Nov 21st, ‘21/6 min read
Strace – A Hidden Superpower
As with any operating system, it’s not uncommon to encounter issues while running Linux and associated applications. This is especially true while using closed-source programs since granular code inspection isn’t possible.

As with any operating system, it’s not uncommon to encounter issues while running Linux and associated applications. This is especially true while using closed-source programs since granular code inspection isn’t possible. Consequently, troubleshooting and solving problems isn’t a straightforward process. Linux admins and engineers quickly discovered that supplemental utilities were needed. Thankfully, they didn’t have to wait very long.
Strace launched shortly after Linux to address many of these concerns. Officially dubbed a Linux syscall caller, “Strace is a diagnostic, debugging, and instructional userspace utility for Linux,” as stated on the official website. You can use Strace to oversee and manipulate how processes interact with the Linux kernel. This includes:
- System calls
- Process state changes
- Signal deliveries
Accordingly, the utility can also help you iron out issues with your own applications. Such applications often interact externally with other resources, so understanding those mechanisms is essential. The Linux kernel’s `ptrace` feature ultimately enables Strace to work its magic. `ptrace` itself was created to facilitate system call tracing and breakpoint debugging.
Strace continues to be open source to this day. Repositories live within both GitHub and GitLab, and binary packages are also available through a variety of sources. Strace’s development pace is somewhat more deliberate, yet its developers continue to push new releases.
This introductory guide dives deeper into Strace, exploring its use cases, instructions for harnessing it, and best practices for doing so.
Why Strace – Considerations and More
First, it’s good to know the capabilities and limitations of Strace. While the tool provides plenty of useful functionality, it’s not meant to handle every Linux troubleshooting process imaginable. Within Strace’s own documentation, the following operations are explicitly called out:
- Attaching to a running process
- Printing paths and details associated with file descriptors
- Filtering by syscall types
- Tracing system calls only via specific paths
- Performing full hexadecimal and ASCII dumps of all the data read/write from file descriptors
- Performing syscall fight injections
- Counting syscall total time, calls, and errors
The complexity with which you use Strace can vary widely. You can enter a short, one-line command within the Linux CLI and run it until it exits. Conversely, operations like hexadecimal data dumps can require inputting large numbers of specific parameters, attributes, and more. Naturally, these commands can take more time to execute and, thus, are more error-prone.
Strace intercepts and records system calls stemming from specific processes and their associated signals. Resultantly, Strace prints any associated arguments and returned values to two different destinations: on standard error or to a predetermined file. You can specify this file name by typing the `-o` option and entering the file path.
It’s easy to trace standalone processes using Strace; however, you might notice that Strace fails to capture all the information you’d expect during command execution. This is where child processes come into play. The parent process you’re tracing may have a number of secondary processes associated with it. Thankfully, you can capture these child processes via the `-f` option while subsequently attaching your program name.
Strace Syntax
Strace and the Linux CLI leverage multiple operators within each Strace command. These options serve different purposes, and you can therefore use them to perform very specific actions. Here are some common Strace command building blocks, called options:
[-I *n*] – specifies an interruptible signal
[-b *execve*] – used for detaching from the specified syscall or tracing multi-threaded processes
[-e *expr*] – modifies which events to trace or how to trace them
[-O *overhead*] – sets the overhead for tracing system calls
[-S *sortby*] – sorts printed histograms by a certain criterion
[-U *columns*] – configures the order and set of columns displayed
[-a *column*] – aligns return values in a specific column
[-o *file*] – specifies a print destination
[-s *strsize*] – specifies the maximum printable string size
[-X *format*] – sets the format for printed, named constants, and flags
[-P *path*] – traces only calls accessing a given path
[-p *pid*] – attaches to a given process with the process ID stated and starts tracing
[-E *var=[val]*] – runs a command with a given var=val in a list of environmental variables
[-u *username*] – runs commands with a user ID, group ID, or supplementary groups
The italicized portion within each bracket represents either a value or qualifier that helps Strace understand what it’s supposed to do. This isn’t an exhaustive list of Strace commands and syntax (find that here under the **options** section), yet it offers a snapshot of some essential functions you can leverage.
There are some key system calls you should also become familiar with:
read– reads bytes from a file descriptorwrite– writes bytes from a file descriptoropen– opens a file and returns a descriptorclose– closes a file descriptorfork– creates a new process while forking a current processexec– executes a new programconnect– connects to a network hostaccept– accepts a network connectionstat– reads file statisticsioctl– sets I/O properties or other functionsmmap– maps a file to the process memory address spacebrk– extends the heap pointer
The main takeaway is this: even by leveraging information from these basic lists, you can still perform a plethora of operations using Strace. The list of available calls and options is vast, and their functions touch on most application or OS elements.
The Linux CLI spits out a response beneath your command in a human-readable format; however, the complexity and length of these responses can vary quite widely. Strace’s outputs *can* be overwhelming.
Those familiar with the Linux CLI (which is recommended if you’re traveling down this rabbit hole) can use the `echo` attribute to promote better spacing and overall formatting. You can instruct Strace to output to standard output as opposed to standard error.
Cons of Strace
It’s important to understand just how deeply Strace can interact with your applications and underlying system. You mostly operate in “user mode” from an OS standpoint—the command line and GUI elements are home bases for any actions performed during normal use; however, the picture becomes a little more complicated when system calls are introduced. These calls operate in the background at a deeper level and interact directly with the Linux kernel. Syscalls enjoy elevated privileges by default and have massive influence over system performance.
As you’d imagine, interrupting, manipulating, and making new calls can cause problems. Strace pauses the target process for each syscall twice to analyze it properly. During those instances, Strace reads and records process states. Unfortunately, these operations can pause your application too often when used liberally. There’s also continual context switching that occurs as a result, upping execution time while the system switches gears.
Accordingly, Strace’s performance overhead changes according to the syscall in question. Unfortunately, adding Strace onto existing system calls can slow their execution time to a relative crawl. This may be problematic, depending on your workflows. More recent iterations of Strace have helped mitigate these performance penalties, though it’s still worthy of consideration.
Sample Strace Call
Here’s an example of a simple Strace command, where you attach Strace to a process that’s currently running:
$ strace -p 1267Your output confirms that the command was executed and shows that Strace has now “mounted” the process in question:
strace: Process 1267 attachedThis is one of the simplest outputs you’ll likely see when using Strace. Alternatively, if you perform something like a *count* command, the CLI will instead display a table with contextual results:
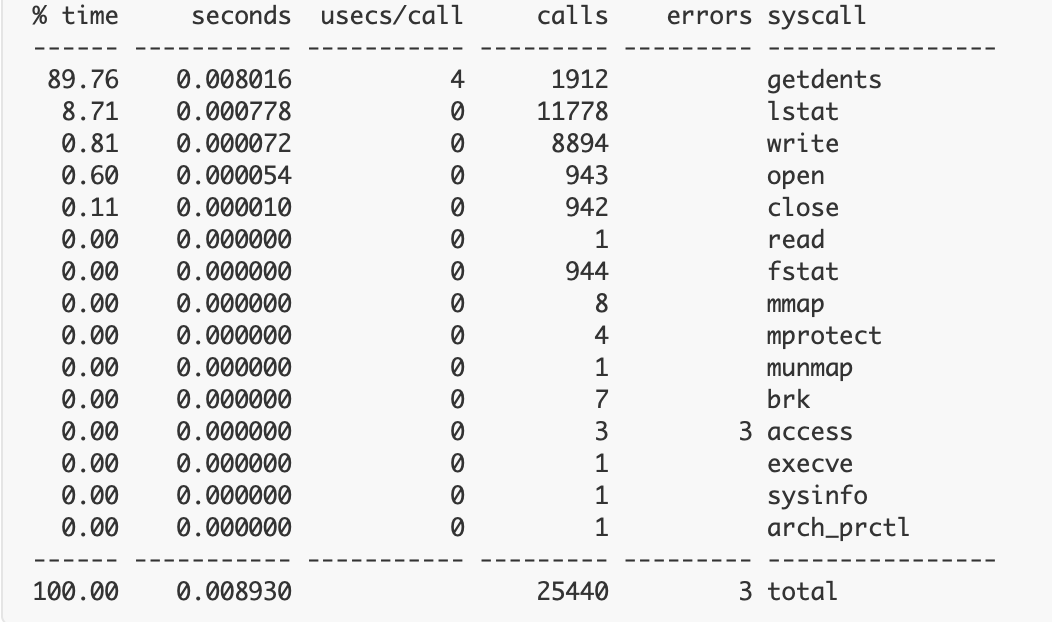
Strace’s outputs, thus, vary widely, yet—while they’re not always highly approachable for novices—they can be easy to interpret. Running a program command is pretty similar and leverages one of the multiple system calls touched upon earlier. What if you want to print only open syscalls? Simply input the target process ID within the PID attribute to kickstart the process:
$ strace -eopen -p PIDStrace Usage Scenarios
Overall, Strace may be best or “most responsibly” used within testing or staging environments. In these instances, both performance and command safety aren’t critical—especially since you’re not impacting application users with interruptions. Strace’s wrapper and outputs can provide massive amounts of troubleshooting information.
The dynamic performance overhead of Strace can introduce some uncertainty into production environments. Exceeding latency thresholds can lead to target failover. That said, Strace might be essential in certain production scenarios. Just like chaos testing requires some level of live user experimentation to uncover issues, properly fixing issues might not be possible when applications are sandboxed.
Conclusion
In the right scenario, Strace is a clearly useful tool for debugging and troubleshooting. It can help provide a deeper understanding of your application and how it interacts with the Linux kernel during runtime. This transparency also extends to third-party apps.
Strace isn’t perfect in all situations; however, its flexibility attracts experienced admins. Overall, Strace helps build upon Linux’s open-source foundation—providing insights you might not otherwise get.
(A big thank you to Tyler Charboneau for his contribution to this article)
Contents
Newsletter
Stay updated on the latest from Last9.
Handcrafted Related Posts

High Cardinality for Dummies: ELI5
High Cardinality woes are far & frequent in today's modern cloud-native environment. What does it mean, & why is it such a pressing problem?
Mohan Dutt Parashar

SaaS Monitoring with Levitate
How Levitate solves today's challenges of B2B SaaS monitoring, including noisy neighbors by unlocking per-tenant observability
Prathamesh Sonpatki

Last9 completes SOC II Type 2 Certification
The comprehensive audit validates Last9 as a trusted SRE partner; a crucial process to work with highly regulated industries.
Abhi Puranam