Oct 18th, ‘22/7 min read
Static Threshold vs. Dynamic Threshold Alerting
What's the difference between Static Threshold vs Dynamic Threshold Alerting? Do you really know when and how to use each threshold type?

All IT teams have had to manage monitoring and alerting systems to effectively respond to incidents affecting their product. These systems help keep everything up and running and provide a smooth and uninterrupted experience for users.
The challenge with alerting is to find the right balance. An oversensitive alerting system will mean you’re submerged in alerts, leading to response team exhaustion. An under-sensitive alerting system may cause you to miss important alerts for events that impact customers. Neither of these scenarios is ideal. Knowing the right approach to alerts is essential.
Many different strategies can be adopted to detect anomalies. Key among these are static and dynamic thresholds. But do you really know when and how to use each threshold type?
This article will compare these two types of alerts and summarize when each type should be used.
Static Threshold vs. Dynamic Threshold: A Brief Comparison
Both thresholds are useful in specific circumstances, and can actually be used simultaneously for the best results. However, each has some areas where they are more efficient, so the crux is to understand when to use them.
Before comparing the characteristics and cases of these two types of thresholds, a brief comparison of the two can help understand their fundamental differences.
A static threshold is a simple rule for determining if an anomaly or problem is worth investigating by comparing observed data points against a limit. When a limit is exceeded, the alert is triggered, and teams are alerted of the anomalies. A static threshold needs to be determined and set manually.
A dynamic threshold is an algorithm-centric approach that considers the overall pattern of observed data points and compares them against historical values to find anomalies. When the computed threshold is exceeded, an alert is triggered, and teams are alerted of the anomaly. These are automatically determined from the data.
Dynamic thresholds are more complex, as they require greater data processing power and more intelligent systems. Thus, they can be harder to implement. Needless to say, without the proper tools or monitoring platform, having a dynamic threshold would be a challenge. However, this complex system also provides one of the top benefits of dynamic thresholds—greater accuracy.
Anomaly detection is the main feature provided by dynamic thresholds. A dynamic threshold considers trends in your data and aims to remove most flickering alerts that result in false positives. This is possible because historical data holds much information about what is normal for your system. However, in edge cases, expert input about the limits of a system is better than extrapolated (dynamic) thresholds. With a dynamic threshold, fewer human inputs are required, resulting in more monitoring out of the box; thus, this solution is considered more scalable.
Now, push the comparative a little bit further by looking at static and dynamic thresholds from the perspective of each of the three highlighted factors:
- Configuration complexity
- Accuracy (false positives, false negatives)
- Scalability
Static Threshold Alerting
Static threshold alerts are effective when monitoring metrics like CPU spikes, memory usage, or disk usage. Static thresholds’ strength is their simplicity: there is only one trigger point for an alert based on a single metric. For instance, 90% CPU usage to 80% disk usage. Creating a good static threshold is easy when measuring a finite quantity because what you’re measuring is tangible. You know that running out of disk space is bad news.
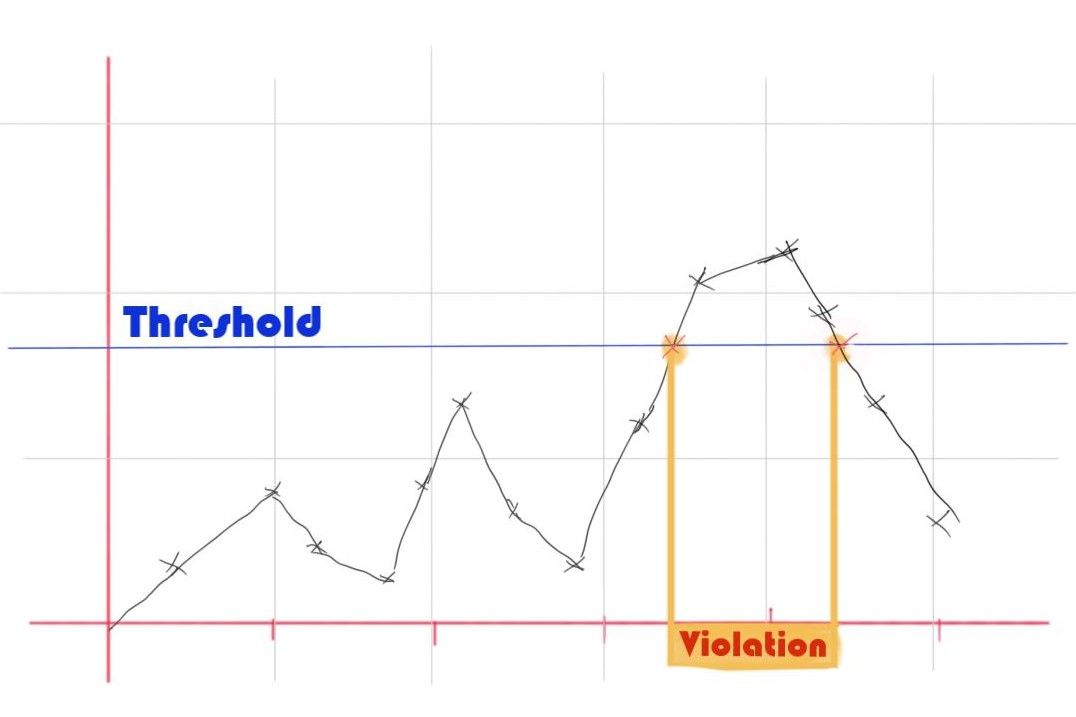
What a Static Threshold Looks Like
If you are unfamiliar with static thresholds, you can think of them as a flat line in your time chart. The threshold is violated whenever this line is crossed, and an alert may be triggered. In reality, alerts won’t always be triggered, as you'll often add a condition violation duration to avoid false positives. For instance, 90% CPU usage for five minutes would trigger an alert.
The Downside of Static Thresholds
However, static thresholds are not so well-suited for monitoring the availability of your services. Unhealthy systems are often characterized by metrics like error logs, HTTP connection errors, and latency. Defining a static threshold for those metrics that would confirm an outage, but not trigger every small error in the system is challenging. For instance, a few HTTP 5xx server errors could be acceptable from time to time; however, the acceptable number of HTTP errors is hard to define and is tightly coupled to other variables, like traffic or even user behavior at different times of the day.
Static thresholds are easy to set up for locating symptoms of a system failure when tangible or physical limitations are involved. However, they fail to capture system health efficiently because a single limit cannot capture the full context of a complex system's state. In most cases, you run the risk of being overwhelmed by false positives because it's almost impossible to define the perfect static threshold that would only trigger when something significant is happening.
Static Threshold Improvement with Service-Level Objectives
One consistent way to improve your static threshold is to reframe a metric as a percentage of an error budget and compare the metric to user impact. For instance, to measure the health of your authentication system, you could trigger an alert if the login latency for 5% of users is greater than 200 milliseconds. In this case, you look at the proportion of users impacted by another metric—degradation.
This powerful approach to static thresholds, known as service-level objective (SLO), was introduced by Google in their Site Reliability Engineering handbook. The SLO approach improves thresholds by reframing the problem and asks this question: what metric can you define that will alert you of significant degradation in your system? This approach can greatly improve your monitoring with a simple static threshold.
To sum up, static thresholds are simple, so it’s unsurprising that these have some limitations in terms of accuracy. However, they are effective in resource monitoring and creating SLOs. You should also note that setting the static threshold is a manual process that is not scalable when it comes to a large microservice ecosystem.
Here is a guide to Service Level Indicators and Setting Service Level Objectives
Dynamic Threshold Alerting
Unlike manually assigned static thresholds, dynamic thresholds can cover a wide range of metrics and find normal and abnormal behavior. This is a real advantage that allows dynamic thresholds to scale with your ecosystem; whenever you add new applications, you can be sure you’re monitoring all available variables and eliminating blind spots.
However, as with any statistical or AI-based process, a lot of data is required to build the model. As a result, relying solely on dynamic thresholds would not be wise as it can take some time for the system to provide meaningful results, and some applications with low traffic or low activity could result in low-quality thresholds due to the lack of data.
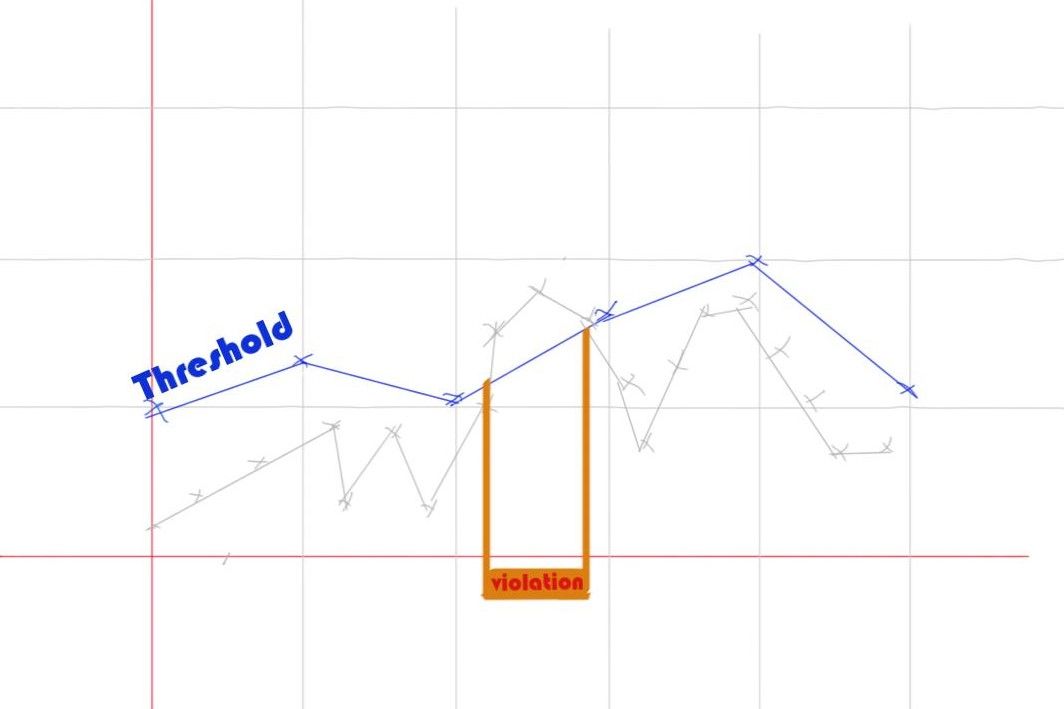
What a Dynamic Threshold Looks Like
For the sake of the comparison, you can think of a dynamic threshold as a line segment in your time chart. Once again, when a line segment is crossed, the threshold is violated, and an alert may be triggered. You can see those dynamic thresholds are much closer to the natural trends of your data and attempt to catch anomalies.
Problems That Dynamic Thresholds Solve
As mentioned earlier, static thresholds do not provide the best representation of the system's health because they fail to capture trends characterized by rates of change, seasonality (daily/weekly), and correlation between variables. In situations like an increase in error rate, dynamic thresholds tend to be more accurate (fewer false positives) and can even trigger faster than a static threshold on the same metric, making them extremely valuable. This improved performance is because dynamic thresholds are a better fit for historical data, while a static threshold is a one-size-fits-all value.
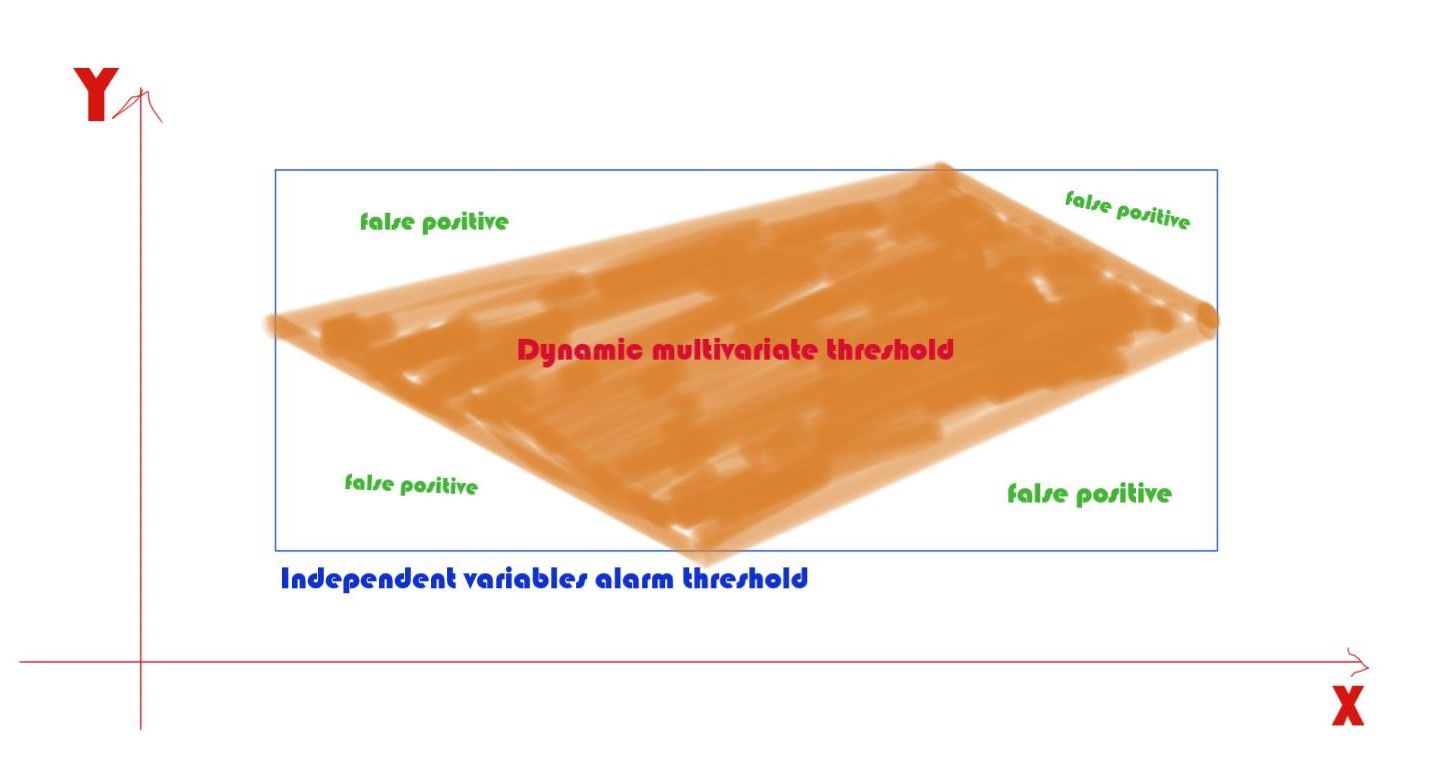
In a complex system, monitoring variables independently often results in a chain of alerts firing simultaneously. With dynamic thresholds, you can couple variables together in these cases to create a more precise alert and reduce false positives.
This is often referred to as a dynamic multivariate threshold. It may sound complicated, but if you are using a monitoring platform that supports a multivariate solution, then it's as simple as selecting which variables to involve in this dynamic threshold.
A less complex example of dynamic thresholds is coupling metric degradation with a recent deployment to help developers find the root cause of an issue. For instance, you could check system latency with deployment events to see if a recent deployment reduced the system's performance.
Dynamic thresholds use statistical analysis to solve static threshold flaws in terms of accuracy. The fact they are automatically generated means there is little to no import from development and operation teams to set them up — meaning they are a very scalable solution with no additional setup complexity.
Conclusion
Organizations can use both static and dynamic thresholds, depending on their objectives. Static thresholds are appropriate for small and medium-sized organizations that monitor a limited number of variables or when a quick reaction is not required. However, when your organization grows, dynamic thresholds' scalability becomes essential as it can relieve engineering teams from manually setting thresholds.
When you want to detect an anomaly, it's best to use dynamic thresholds because they are more sensitive and provide a better (more accurate) representation of your system's health. However, static thresholds are appropriate if you want to monitor tangible resources (CPU, memory, disk). Static thresholds can also use a safety trigger based on defined system limitations.
Finally, dynamic thresholds do not represent additional configuration complexity as your monitoring platform abstracts the data processing pipeline in most cases. They should even be easier to set up at scale.
Levitate is one example of such a monitoring platform. It's an intelligent platform that reduces alert fatigue and helps your team pinpoint the changes that trigger incidents.
Contents
Newsletter
Stay updated on the latest from Last9.
Handcrafted Related Posts

A case for Observability outside engineering teams
Observability is being built by engineers for engineers. In reality, o11y is for all.
Aniket Rao

What is OpenTelemetry
Learn what is OpenTelemetry: The open-source observability framework for collecting and processing telemetry data from applications and systems.
Last9
Static Threshold vs. Dynamic Threshold Alerting
What's the difference between Static Threshold vs Dynamic Threshold Alerting? Do you really know when and how to use each threshold type?
Last9