Nov 29th, ‘22/4 min read
India vs Pakistan, Site Reliability Engineering, and Shannon Limit
How does one ‘detect change’ in a complex infrastructure, so you don’t lose out on critical revenues — A short SRE story
The average human’s bandwidth to process data and information into perception is about 41 bits/second. This means, of the million things happening around you, a human being can process limited information at any given time. This is the ‘Shannon Limit’ for a human being.
Given the Shannon Limits around human bandwidth consciousness, nobody can process petabytes of information emanating from a complex architecture. This is important to understand if you’re a Site Reliability Engineer (SRE). Every SRE works with distributed systems that have multiple failure points. As such, building system resiliency is a complex problem.
If you want better observability of your micro services, you need observability tooling. All paths to building observability lead us to… Dashboards. This is the bitter truth. If there was a better way to negate dashboards, we would. But there isn’t.
But, here’s the problem with Dashboards. They can’t tell you what’s wrong. They are, at best, latent analysis of past failures. I mean, take a look at the below Dashboard 👇
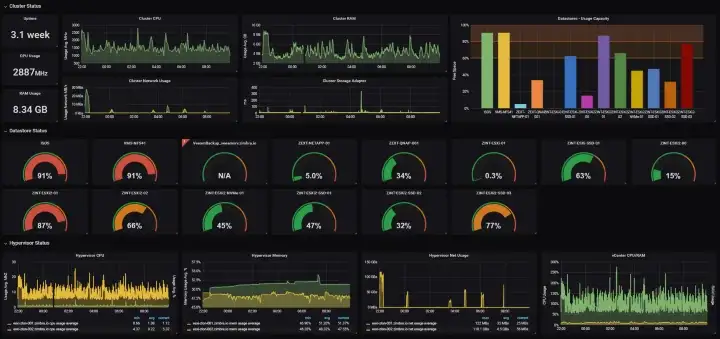
Without a tête-à-tête with the engineer who built this, the Product person who conceptualised it, and a designer who stitched it, it’s impossible to decipher what’s happening here. 😂
It’s way past the Shannon Limit of human consciousness. Given all the cognitive load engineers have to manage, this randomness is painful to sift through. Dashboards are not the solution.
💡 Dashboards. aka; static, dumb, representations of your past failures. 😜
What you really want is the ability to talk to the dashboard. It’d also sure be nice if the system could tell you what’s wrong when something is wrong. That would be useful, less-time consuming, and help in myriad ways. What you need is…
A ChangeBoard.
India vs Pakistan cricket match — 20+ million concurrents
Imagine a big-ticket event like India vs Pakistan cricket match. It has 20+ million concurrent viewers. That’s 20 million people watching a live-streaming match at the same time across geographies. It’s unprecedented scale.
Given the lack of playbooks to manage this scale, Murphy’s Law takes grip; what can go wrong, will go wrong. Also, given how many complex elements come into play during events such as these, things are likely to go wrong at the worst possible time. 😢
Grokking 1000s of events across a complex architecture is hard at this scale. Throughputs, 5xx, latencies across systems, playback times, payments infra, content infra in distributed geos, and segmented ad buckets. The list is endless. How do you pay heed to what’s important? How do you fix something before it breaks?
This is where Last9’s ChangeBoard comes into play.
Telling you something is amiss, and you need to pay attention before it completely breaks. This ability to talk to you, so you can take preventive action is what makes detecting ‘change’; so valuable.
ChangeBoards in action — A short story
This is the Last9 ChangeBoard 👇
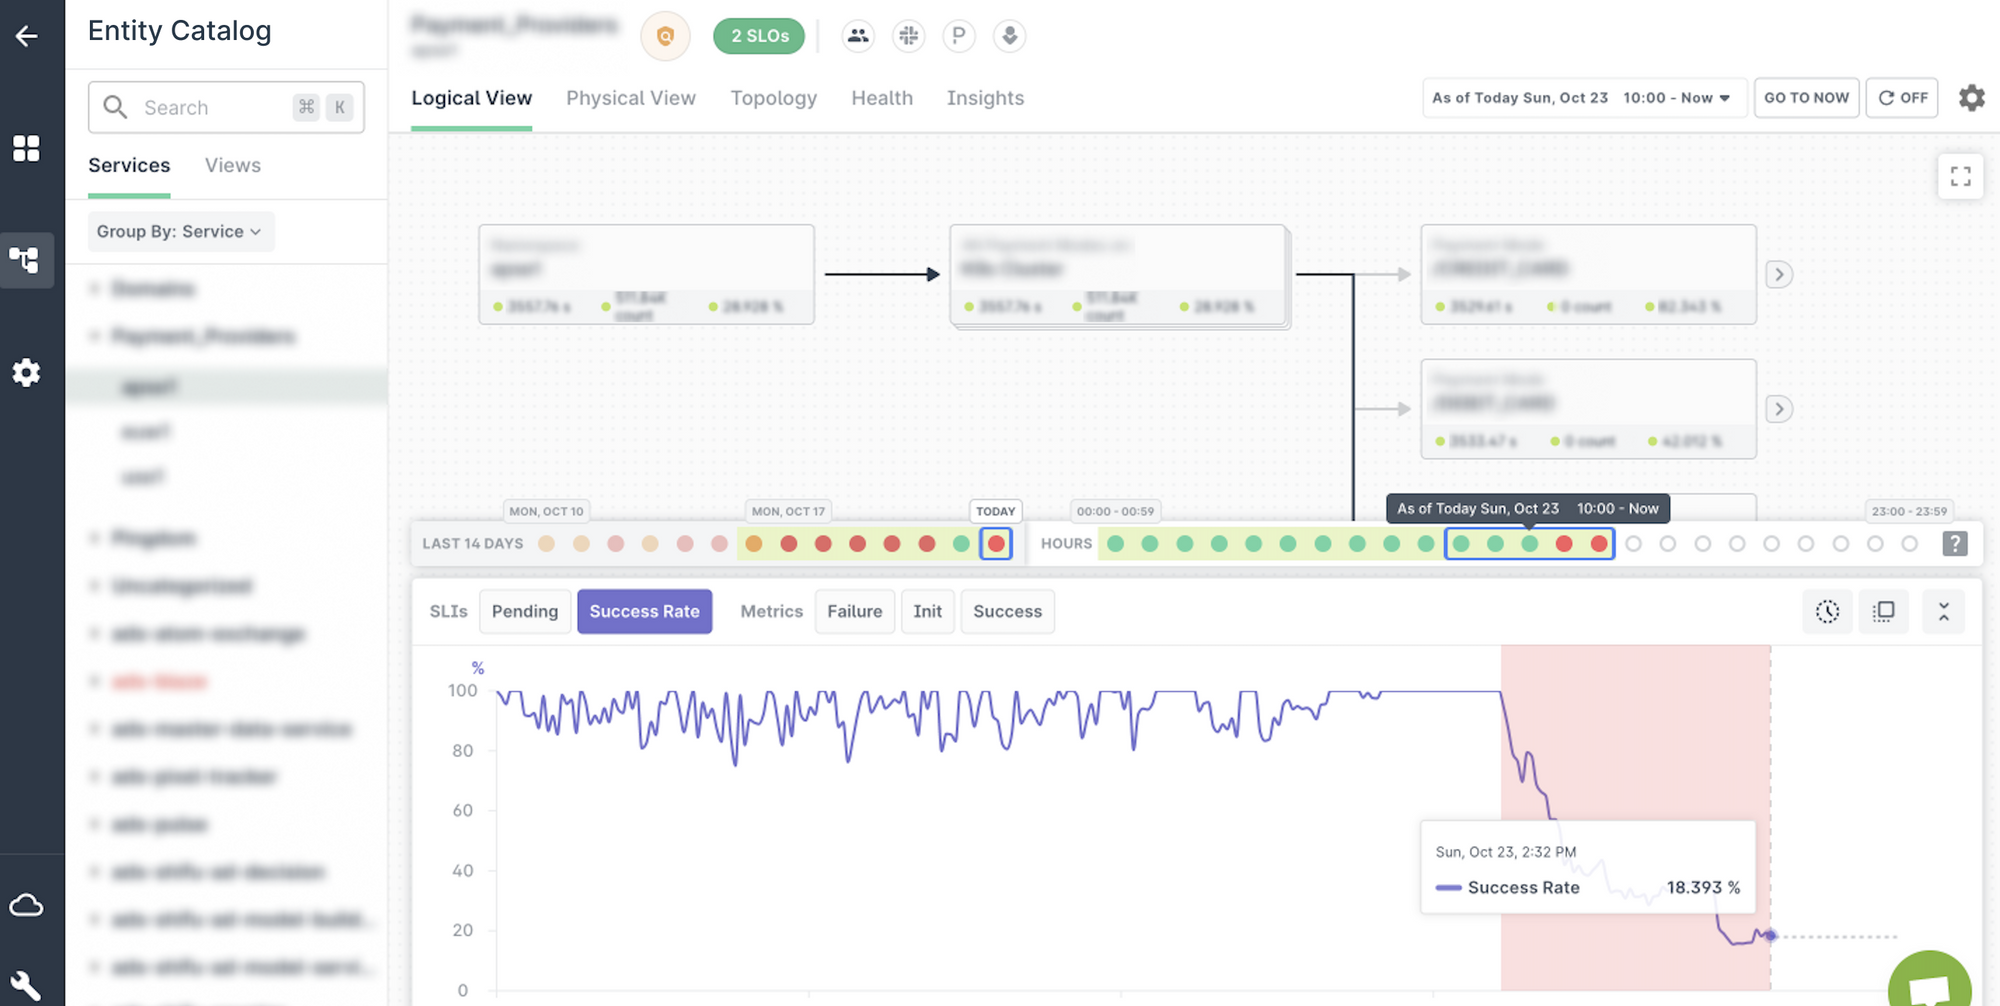
It intuitively tells you something is amiss, and you need to pay attention.
At the very basic, the green turns red. Engineers get alerted. The system is talking to you 🟢
Let’s probe further 👇
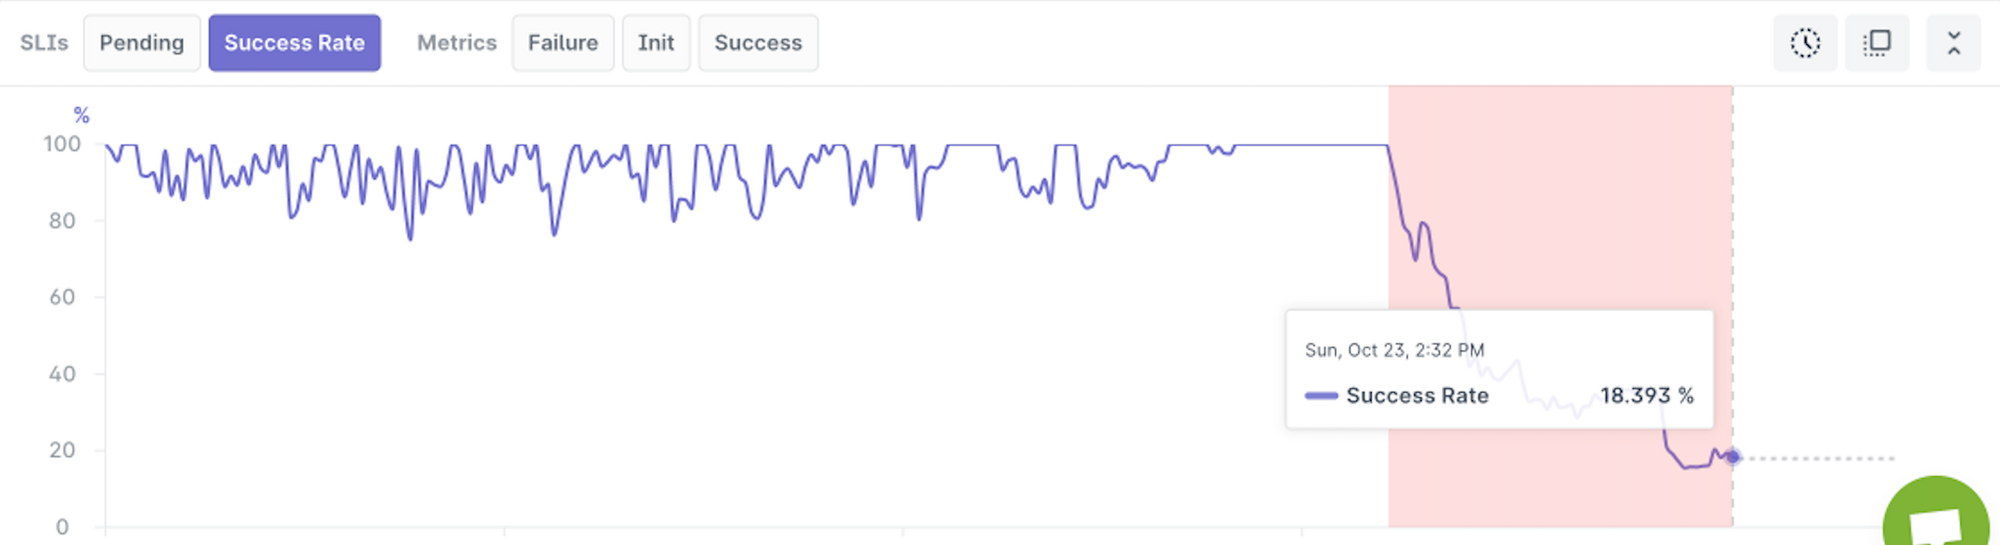
Last9’s ChangeBoard was able to detect that customers were facing a sudden drop in payments subscription with one particular fintech provider. In fact, there’s a dramatic dip.
To be clear, this is not an issue with the provider of content streaming. It was a third-party payments provider which was experiencing some issues at their end. Unfortunately, that affected the ability of the content streaming service to earn revenue from people who wanted to pay up, and watch the cricket match!! 🏏
💡 It’s a direct loss of revenue. Imagine having a robust infrastructure in place, but you’re being hampered because of a 3rd party degradation that’s not even under your control.
Because our ChangeBoard was able to spot this, the engineering team was immediately able to switch payments to another provider.
The ability to identify this issue at the right moment meant one could shut down this payment provider, and activate another. This is valuable for a business running at scale. Usually, this entire process happens when irate consumers complain on social media, or is detected much later; and sometimes it just remains undetected.
ChangeBoards detect deviations, and alert engineers to pay attention to only the most relevant things.
Take another look at this image below 👇
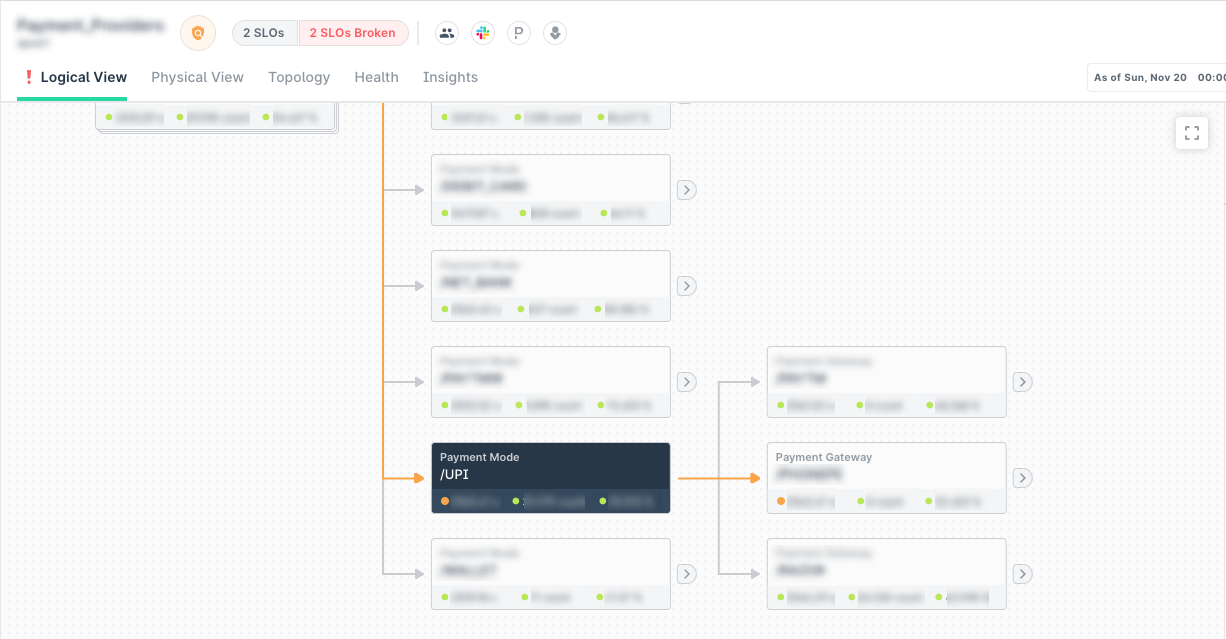
It gives you a clear picture of the health of each service. Under, one of the `Payment Gateways` is down. The other two are just fine.
The ability to drill down and isolate an incident at its root cause is powerful. It reduces your Mean Time To Detect (MTTD) an issue. You don’t need to summon crazy war rooms all the time. Above all, it empowers your Customer Support teams. You don’t have to rely on engineering for identify issues and communicate with customers. Dependencies reduce dramatically.
Proactively switching the available payment option meant thousands of $ were saved from customers who wanted to pay but could not.
Site Reliability Engineering is about needles in a haystack. With the right tooling, you forfeit the Shannon Limits of human consciousness to software✌️. Intriguing? You might want to talk to us. Book a demo, we’ll walk you through all the fun things we’re building at Last9.
P.S. Much thanks to Ujjwal, Prathamesh and Tripad for advice, and help on this post. 😍
Want to know more about Last9 and our products? Check out last9.io; we're building reliability tools to make running systems at scale, fun, and embarrassingly easy. 🟢
Contents
Newsletter
Stay updated on the latest from Last9.
Handcrafted Related Posts

Prometheus Monitoring
Prometheus is a popular open-source monitoring system. In this blog, we'll cover the basics of Prometheus monitoring, including its architecture, key features, and alternatives.
Last9

Golang Concurrency Masterclass by Swati Modi at Gophercon 2023
Talk on Golang Concurrency Masterclass by Swati Modi at Gophercon 2023
Last9

Software Monitoring — Stuck in the 00s
A short history of software monitoring, from the 00s. What has changed? Why are things so arcane?
Piyush Verma