Oct 27th, ‘22/6 min read
Challenges of Distributed Tracing
What are the challenges, benefits and use cases of distributed tracing?
The architecture and deployment of modern applications are complex. A typical request in a modern application is processed across multiple systems before it is serviced and a response is sent. These services can be either synchronous or asynchronous. This complicates tracking and fixing performance issues or bugs discovered during testing and production. As the number of hops between systems increases, root cause analysis (RCA) worsens. This is exacerbated by increasing numbers of concurrent system users in modern applications.
The typical troubleshooting information available from logs, such as the date/time, module/class, and message, isn't enough to pinpoint the source of the problem. This is because there is no reliable method for connecting individual log entries into a sequence. The context of the log entries must be used to infer a sequence.
The best solution is to introduce an explicit trace ID that is propagated through all system hops. This allows log entries to contain the same trace ID throughout the processing of a given request. Distributed tracing is the process of adding such a trace ID to the processing at the request start point and ensuring the trace ID is passed to the various systems as the request passes through them.
This article explains why distributed tracing is necessary, what the various benefits of distributed tracing are, and why it is absolutely necessary to invest in distributed tracing from the beginning of the project, should you choose to adopt this form.
Distributed Tracing Use Case
Consider the implementation of a blood pressure (BP) meter in an Internet of Medical Things (IoMT) platform: a patient uses the meter to record their blood pressure on a regular basis. The meter is configured to send an alert to the patient's caregiver if their blood pressure falls below a certain threshold. This reminds the patient to take a reading if he or she has missed more than two readings.
For this use case, a system implementation collects and stores the patient's readings periodically in the cloud. A watchdog is set up to detect when the data collected exceeds the threshold and sends a notification. The watchdog also checks for missed readings and sends a control message to the gateway requesting that the patient take a reading. The following diagram depicts the services involved in implementing such a system:
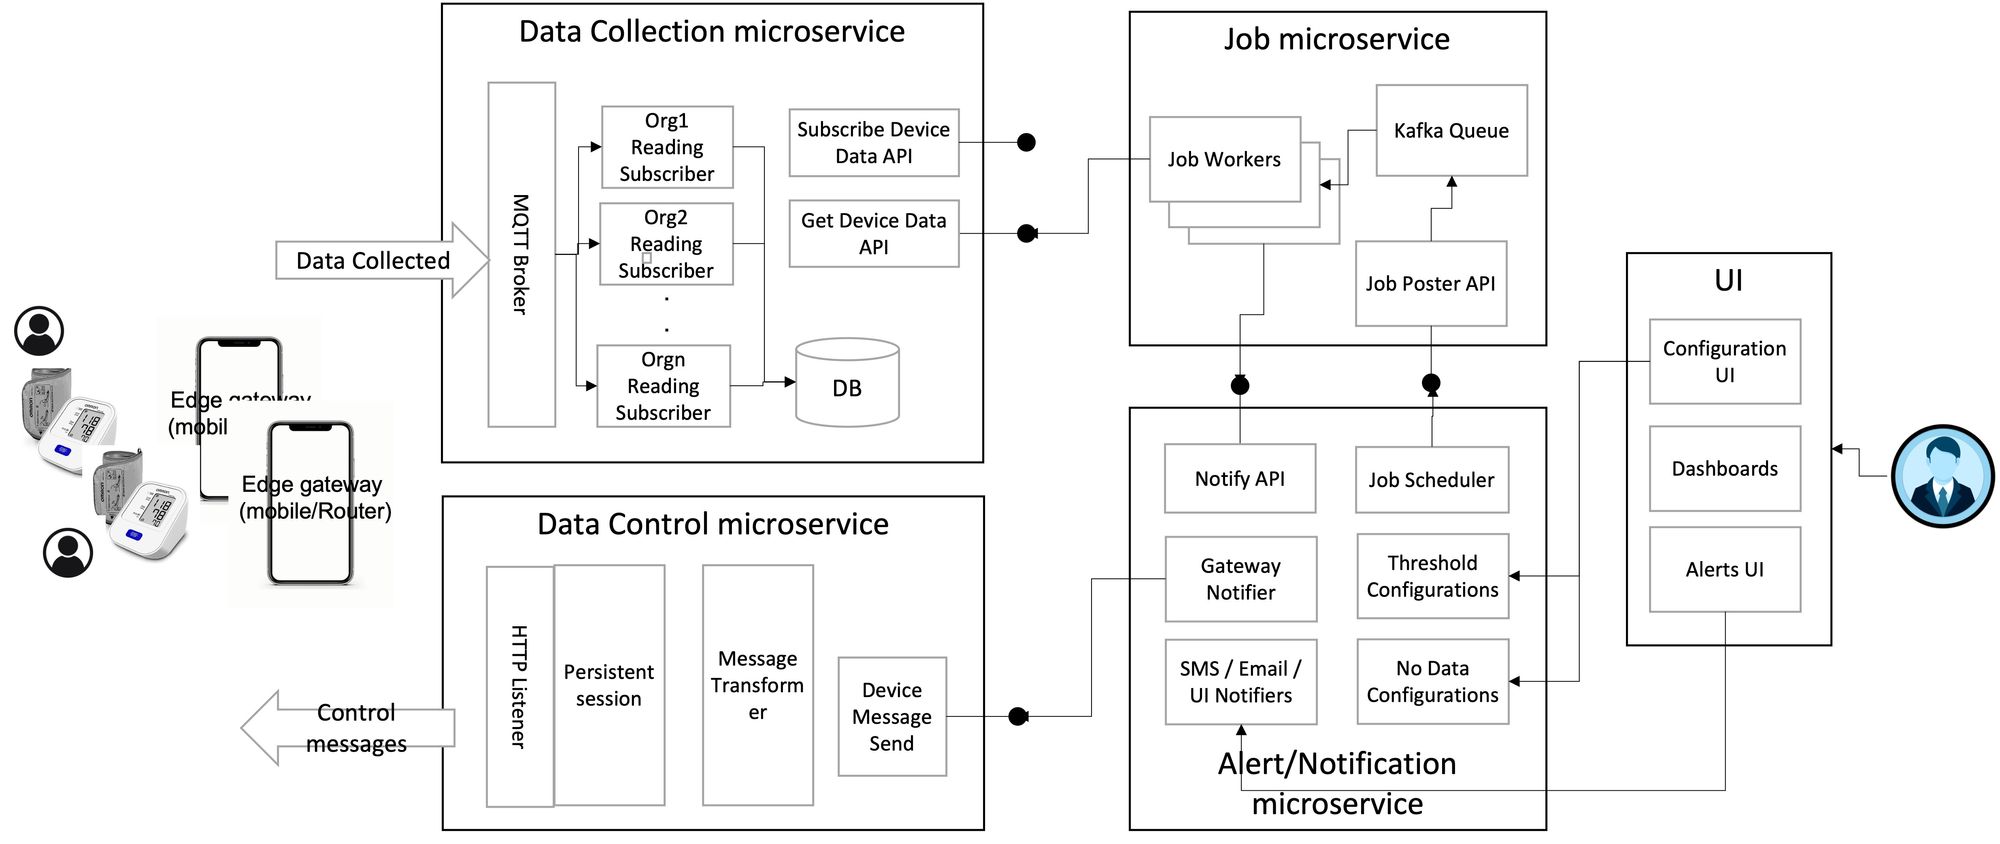
In this system, the data from the sensor (such as a BP meter, thermometer, and weighing scale) that needs to be collected and sent to the caretaker passes from:
The device to the gateway — to the data collection microservice — to the job microservice — to the notification microservice.
Root Cause Analysis Difficulties
The earlier use case is a highly simplified implementation. Yet it has a minimum of four touch points before a notification is sent, illustrating the complexity of microservices architecture.
Troubleshooting a problem in this complex system can be challenging. For example, debugging why a notification was not sent when the patient's BP level dropped below the threshold.
As you can see from the diagram, the problem could have several causes. The failure could be anywhere along the data pipeline from the device, to the cloud, or in the notifier. To troubleshoot this issue, the flow of the problematic data must be traced from the device to the notification system.
Tracing the problem manually using logs is the most difficult way to troubleshoot. In this method, logs from gateways and the cloud are transferred to a log analyzer system like Elasticsearch and linked to OpenSearch Logs linked to the patient in both the gateway logs and cloud logs can be searched by their timestamps. However, none of this helps in tracing the problematic data and determining the root cause of the problem.
These issues arise as a result of the distributed, asynchronous nature of this business function's execution.
Using Distributed Tracing to Find the Problem
To easily troubleshoot this problem, we need a way to connect the various log entries from the different systems' log files to trace the data flow. This is done using trace ID. When data is collected from the device, a trace ID is introduced at the gateway. This trace ID is kept in the data throughout the flow to the database, the job, and the notification.
So when a problem is reported, we can begin by looking up the trace ID in the database for the BP values that exceed the threshold, and then trace back to the gateway, or forward to the job and notification microservices to determine the root cause. This significantly simplifies the root cause analysis.
Anatomy of a Trace
The following diagram depicts the trace for the previously mentioned architecture and use case using a trace ID:
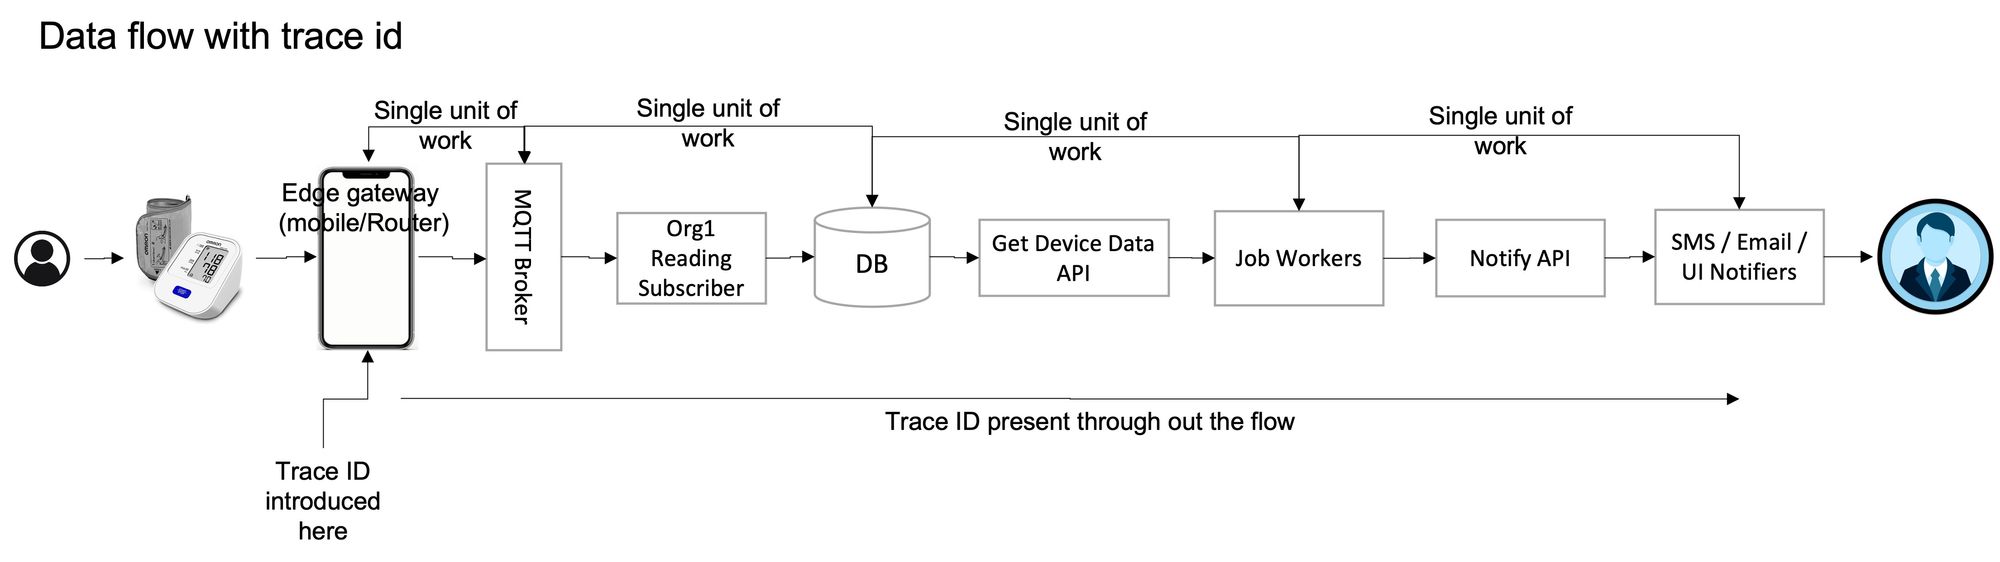
As seen in this data flow, a single trace is composed of multiple units of work. Each unit of work, also known as span, is characterized by the API called, the time taken, the date and time of the start, and the end of the API execution. These are called tags or parameters of the trace.
Benefits of Distributed Tracing
A troubleshooting tool that lists activities and events, flags errors and introduces possible actions the support person can take in case of an error can be built into the system. It can also be used to standardize log file entries. But while logging is simple to set up, in the production environment, log entries are typically set to errors. As a result, implementing distributed tracing with log entries limits the granularity of visibility of the called services. It is best-implemented independently of the application logs.
There are several benefits to having a distributed tracing mechanism built into the system:
- It reduces the mean time to detect (MTTD) a problem and the mean time to respond (MTTR) to the problem because it promotes better visibility throughout your systems.
- The troubleshooting tool allows complete visibility of the services called and the time taken to complete each unit of work. This helps easily identify services that have performance problems.
- It improves service level agreements (SLAs) because the support personnel has complete end-to-end visibility of the various services called, and can be notified when a problem is detected.
- It allows the support personnel to be proactive rather than reactive to a problem.
- Given that you can build in possible response actions, it reduces the involvement of third-party support and developer support that is typically needed in customer support organizations (CSOs).
Challenges in Implementing Distributed Tracing
A built-in tracing mechanism provides several benefits. But there are considerable challenges:
- The first challenge is related to implementing the solution. Tracing can be implemented by either manual instrumentation or by using a product that provides auto-instrumentation.
- Manual instrumentation to transmit the trace ID requires manual coding to record activities and events. This increases the product's coding and testing time, but gives complete control over the important points that are recorded and traced.
- Auto-instrumentation, on the other hand, reduces the coding requirements, but is either highly detail-oriented (with every API call being recorded), or provides very little information (with only system entry and exit points being recorded). OpenTelemetry is one tool that can be used to record and collect trace data.
- The second challenge is related to the size and frequency of usage of the collected data.
- A high volume of transactions passes through software-as-a-service (SaaS) applications. In this scenario, the data collected increases exponentially if a trace ID is introduced manually for all transactions.
- The cost of storage increases with the number of transactions instrumented. While the MTTD and MTTR reduce with the use of a trace ID, it has to be traded off with the cost of storage.
- The return on investment (ROI) for the storage cost of this data is only present if the maintenance and support costs are high. But, this implies that the system has many bugs and the expectation from the business is that the system has no problems. When no problems are present, tracing is not needed for all transactions.
Typically tracing is only needed for those unexpected times when a problem occurs. It is needed so the support team is not left without data to trace the problem. To get an optimal ROI, we need to start reducing the amount of data collected to reduce cost.
Data can be reduced via a head-based decision or a tail-based decision. A head-based decision decides whether to collect samples of that transaction at the beginning of the transaction. This allows you to specify critical transactions that need to be tracked. Here, if a problem occurs in a noncritical transaction, then no data is present to debug.
The other way is to decide at the end of the transaction, that is, a tail-based decision. Here, rather than just tracing important transactions, you can decide to collect the information if there is a problem in the transaction. This gives better visibility to the transaction.
Conclusion
As we saw above, distributed tracing has its benefits, but comes with its own set of challenges. It has its place in the observability ecosystem but is better adopted on a need-to-have basis, after reaching a certain maturity of observability, gleaned through infra and application metrics.
Last9's products provide the right place to start your observability journey. Talk to us here to know more.
Want to know more about Last9 and our products? Check out last9; we're building reliability tools to make running systems at scale, fun, and embarrassingly easy. 🟢
Contents
Newsletter
Stay updated on the latest from Last9.
Handcrafted Related Posts
Best Practices Using and Writing Prometheus Exporters
This article will go over what Prometheus exporters are, how to properly find and utilize prebuilt exporters, and tips, examples, and considerations when building your own exporters.
Last9

Why you need a Time Series Data Warehouse
What is a Time Series Data Warehouse? How does it help in your monitoring journey? How does it differ from a Time Series Database? That and more
Rishi Agrawal

Getting the big picture with Log Analysis
How to get the most out of your logs!
Jayesh Bapu Ahire